This study looks at how U.S. public school districts schedule Thanksgiving break and winter break in 2026–27. We reviewed 10,095 official school calendars from all 50 states and matched 9,941 of them to federal enrollment records covering 41.7 million students, so key results can be read two ways: by share of districts and by share of students.
The study answers one question: why do some American students get 15 days off across the two breaks and others get 27, and which is closer to normal?
In short: nearly all of the gap falls on eight school days, state lines decide most of it, and when the count is by students rather than districts, the longer schedule turns out to be the norm. The findings below summarize each part, and the 50-state table lists every state's figures.
1. Where the Gap Comes From: Eight School Days
Every calendar in the study closes on Thanksgiving Thursday and Friday (November 26–27) and from Christmas Eve through New Year's Day (December 24–January 1). Those nine weekdays are shared by all 10,095 districts. Nearly everything that separates a long holiday from a short one happens on the days around them.
Take two schedules that both appear widely in the data. A district that closes all of Thanksgiving week and runs winter break from December 19 through January 5 gives students 27 days off. A district that closes only Thanksgiving Thursday–Friday and runs winter break from December 24 through January 3 gives 15. The difference is eight school days—November 23–25, December 21–23, and January 4–5—plus the weekends of November 21–22 and December 19–20, which become part of the break once school ends on the Friday before.
Swipe sideways to read the full figure.
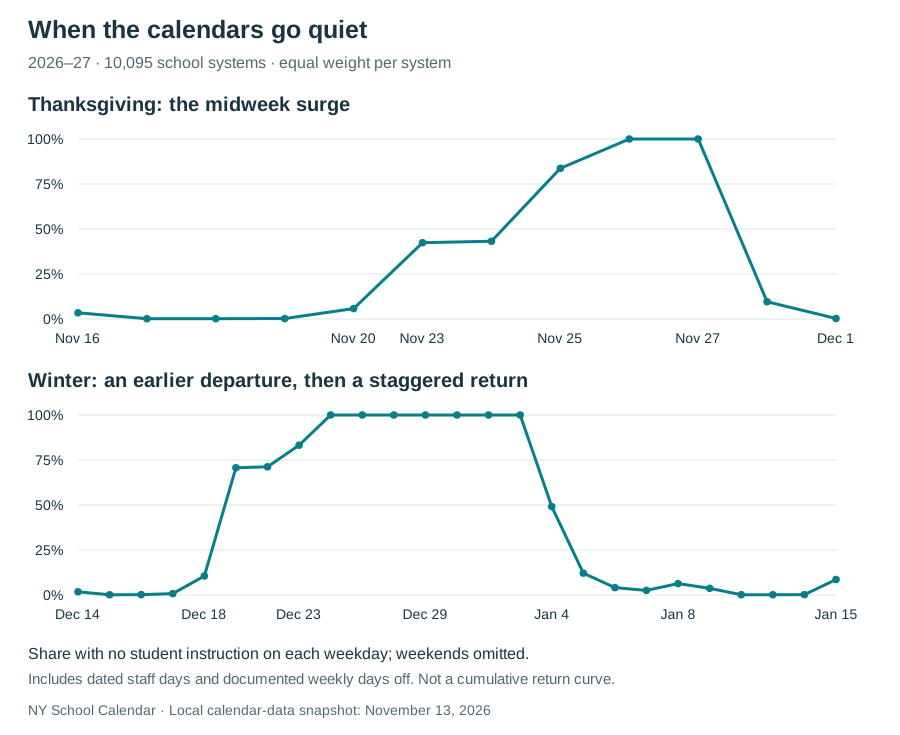
Figure 1 shows how districts divide on each of those days. The table adds the share of students who are off, using the 9,941 districts matched to enrollment.
| Day | Districts closed (of 10,095) | Students off (of 41.73M) |
|---|---|---|
| Mon–Tue, Nov 23–24 | 42.4%–43.2% | 53.3%–53.9% |
| Wed, Nov 25 | 83.7% | 85.4% |
| Mon–Tue, Dec 21–22 | 70.7%–71.2% | 78.1%–78.4% |
| Wed, Dec 23 | 83.2% | 86.2% |
| Mon, Jan 4 | 49.1% | 53.7% |
| Tue, Jan 5 | 12.1% | 18.0% |
Thanksgiving week. The jump from Tuesday to Wednesday reflects the three main Thanksgiving schedules: 42.3% of districts close all five weekdays, 40.5% close Wednesday–Friday, and 16.2% close only Thursday–Friday.
Christmas week. Most districts hold their last class on Friday, December 18 (60.4%, or 6,101 districts). Districts that keep classes into Christmas week mostly stop on Tuesday, December 22 (12.0%) or Wednesday, December 23 (16.8%). Only 54 districts finish on Monday, December 21.
January. Half of districts (50.9%) reopen on Monday, January 4, and 37.0% reopen on Tuesday, January 5.
Why Winter Break Comes in Two Sizes
In 2026–27, Christmas Day and New Year's Day both fall on a Friday. A district that ends classes on Friday, December 18, folds the December 19–20 weekend into the break: 16 days with a January 4 return, or 17 days if January 4 is a teacher workday. A district that holds class through December 22 or 23 gets 12 or 11 days. That is why 65.6% of districts take 16–18 days, 25.0% take 11–12 days, and only 4.2% (421 districts) fall in between. The median is 16 days.
Swipe sideways to read the full figure.
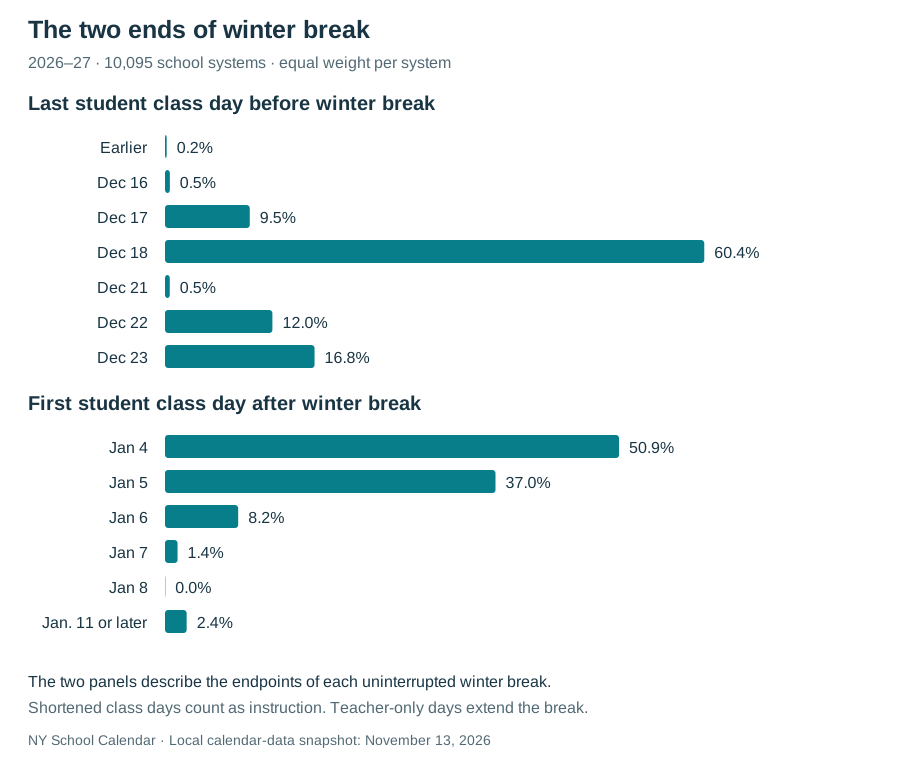
| Last class day | First day back | Days off | Districts (share) |
|---|---|---|---|
| Fri, Dec 18 | Tue, Jan 5 | 17 | 2,892 (28.6%) |
| Fri, Dec 18 | Mon, Jan 4 | 16 | 2,285 (22.6%) |
| Wed, Dec 23 | Mon, Jan 4 | 11 | 1,648 (16.3%) |
| Tue, Dec 22 | Mon, Jan 4 | 12 | 842 (8.3%) |
| Fri, Dec 18 | Wed, Jan 6 | 18 | 622 (6.2%) |
| Thu, Dec 17 | Tue, Jan 5 | 18 | 491 (4.9%) |
The return date alone can hide a large difference. Two districts that both reopen on January 4 can be five days apart before Christmas if one ends classes on December 18 and the other on December 23.
Holiday Labels Undercount Days Off
District calendars often place a teacher workday, conference day, or four-day-week day off next to Thanksgiving without calling it part of the break. Counting every day students are home, 38.1% of districts give a five-day Thanksgiving break, 36.5% give nine days, and 13.7% give four. Another 5.7% give six days and 5.5% give ten because of those extra days. Early dismissals, on the other hand, still count as school days in this study.
2. Who Holds Class on Those Days: States and Metro Areas
Whether a district closes on the eight split days depends mostly on its state. Grouping all 50 states by their Thanksgiving and winter break medians produces three clear groups.
Long breaks. In 11 states, at least 80% of districts close all of Thanksgiving week: Louisiana (100.0%), Mississippi (99.2%), Arkansas (99.0%), Texas and Florida (98.5%), Georgia (98.3%), Oklahoma (97.5%), California (94.5%), Alabama (94.2%), West Virginia (93.2%), and Colorado (81.5%). Across the country, 34 states have a median winter break of 16–18 days, reaching 18 days in Texas, Alabama, and Colorado.
Short breaks. In 12 states—Connecticut, Maine, Maryland, Massachusetts, Minnesota, New Hampshire, New Jersey, New York, Pennsylvania, Rhode Island, Vermont, and Wisconsin—the median winter break is 11 or 12 days. In seven states, no reviewed district closes for all of Thanksgiving week: Connecticut, New Hampshire, New Jersey, Rhode Island, North Dakota, Utah, and Hawaii.
Mixed. Ten states pair a long winter break (16–17 days) with a short Thanksgiving, where 0%–11.9% of districts close the full week: Utah, Hawaii, Nebraska, Montana, Michigan, Indiana, Wyoming, North Carolina, Alaska, and Washington. Four states—Delaware, Iowa, North Dakota, and South Dakota—sit between the two winter sizes at 13 days. Vermont is the only state where about half of districts close all of Thanksgiving week (51.0%) and the winter median is still 11 days.
Swipe sideways to read the full figure.
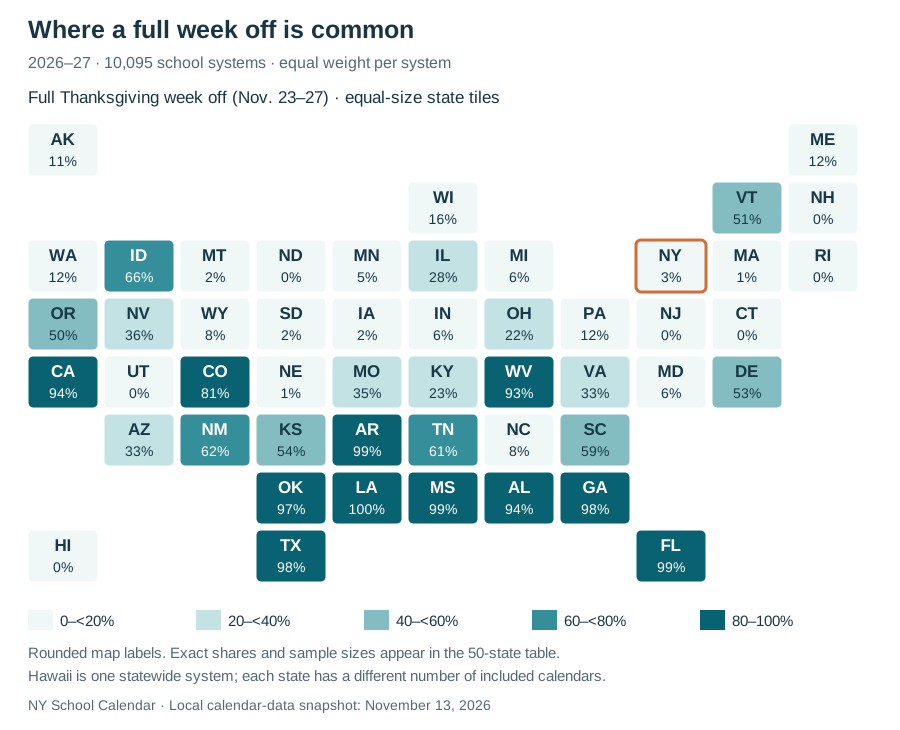
The map shows how sharply the share changes at state lines. Vermont (51.0%) borders New Hampshire (0.0%). Georgia (98.3%) and South Carolina (59.2%) border North Carolina (8.5%). West Virginia (93.2%) borders Virginia (32.5%). California (94.5%) borders Oregon (49.5%), which borders Washington (11.9%). In New York, 74.6% of districts take Wednesday–Friday; across the line in New Jersey, 99.0% (499 of 504) take only Thursday–Friday.
January 4 or January 5
In 29 states the most common return date is Monday, January 4; in 20 states it is Tuesday, January 5; South Dakota is split evenly (47.9% each). Break length predicts the day. All 20 states with an 11–12-day or 16-day median return on January 4. Of the 26 states with a 17–18-day median, 19 return on January 5; the other seven (Alaska, California, Idaho, Nevada, Oregon, Wyoming, and Virginia) start the break earlier in December and still return January 4.
Short-break states also agree more. In 14 states, at least 90% of districts return on the same day, led by Maine, New Hampshire, and Rhode Island at 100%. In 10 long-break states, no single return date covers even half of districts: Alaska, Virginia, California, North Carolina, Alabama, Florida, Indiana, South Dakota, New Mexico, and Georgia. California has the longest tail. It holds 177 of the 242 districts nationwide with a winter break of 23 days or more, and 166 of its 780 districts return on January 11 or 12.
When a State Line Runs Through a Metro Area
For families who live in one state and work in another, these state differences land on specific days. We compared eight metro areas that cross state lines, using Census metro area boundaries, and counted the weekdays between November 16 and January 15 when most schools on one side were closed and most on the other side were open.
Swipe sideways to read the full figure.
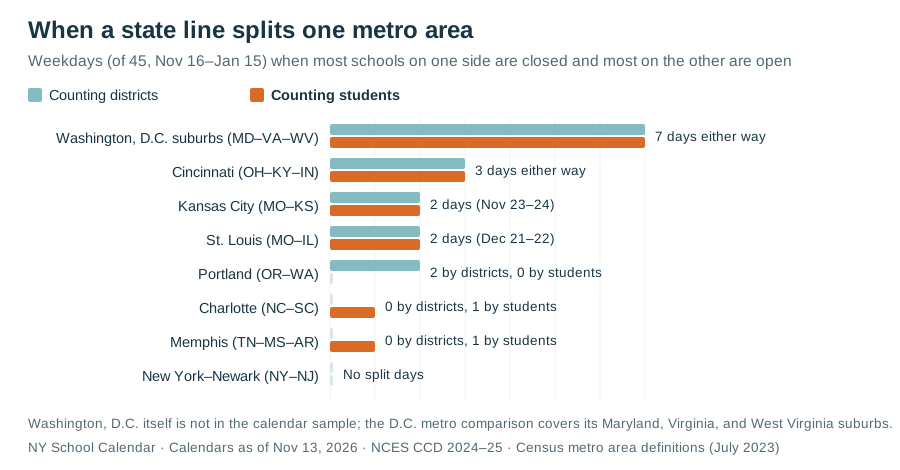
| Metro area | Districts / students | Split days (by districts / by students) | Where the sides differ |
|---|---|---|---|
| Washington, D.C. suburbs (MD–VA–WV) | 18 / 778,498 | 7 / 7 | Maryland and West Virginia differ on Nov 23–25, Dec 21–23, and Jan 4; Maryland and Virginia differ on Nov 25 and Dec 21–23. |
| Cincinnati (OH–KY–IN) | 77 / 302,235 | 3 / 3 | Ohio schools mostly close all of Thanksgiving week and return Jan 5; Kentucky and Indiana schools mostly take Wednesday–Friday. |
| Kansas City (MO–KS) | 77 / 283,713 | 2 / 2 | Kansas side mostly closes all Thanksgiving week; Missouri side mostly takes Wednesday–Friday (Nov 23–24). |
| St. Louis (MO–IL) | 105 / 342,048 | 2 / 2 | Both sides mostly take Wednesday–Friday Thanksgiving, then differ on Dec 21–22. |
| Portland (OR–WA) | 37 / 237,550 | 2 / 0 | Most small Washington districts hold class Nov 23–24; most Washington students, like most Oregon students, are off. |
| Charlotte (NC–SC) | 16 / 388,501 | 0 / 1 | By students, most on the North Carolina side return Jan 4 and most on the South Carolina side return Jan 5. |
| Memphis (TN–MS–AR) | 15 / 90,960 | 0 / 1 | By students, most on the Mississippi side return Jan 6; most in Tennessee and Arkansas return Jan 5. |
| New York–Newark (NY–NJ) | 492 / 2,315,928 | 0 / 0 | Both sides mostly close Thanksgiving Thursday–Friday, take an 11-day winter break, and return Jan 4. |
The Washington, D.C. suburbs split the most, and some of that split happens inside Maryland. Montgomery County gives an 11-day winter break and 15 combined days; neighboring Prince George's County gives 16 and 21. Washington, D.C. itself is not in the calendar sample, so this comparison covers its suburbs only. At the other end, the New York–Newark–Jersey City area lines up completely: both states' districts mostly close Thanksgiving Thursday–Friday, take an 11-day winter break, and return January 4.
Two metros change depending on how they are counted. Around Portland, most small Washington districts hold class on November 23–24, but most Washington students in the metro are off those days, as are most Oregon students. Around Charlotte and Memphis, district counts show no split, but student counts reveal one January day when the two sides differ.
3. Districts vs. Students: What Counts as Typical
Sections 1 and 2 count each district once. That gives a district with a few hundred students the same weight as Clark County, Nevada, with 301,697. The 6,578 districts with fewer than 2,500 students average under 1,000 students each and make up two-thirds of the matched sample. To see what a typical student experiences, we matched 9,941 of the 10,095 calendars (98.5%) to 2024–25 federal enrollment data covering 41.73 million students, or 84.7% of U.S. public school enrollment.
Swipe sideways to read the full figure.
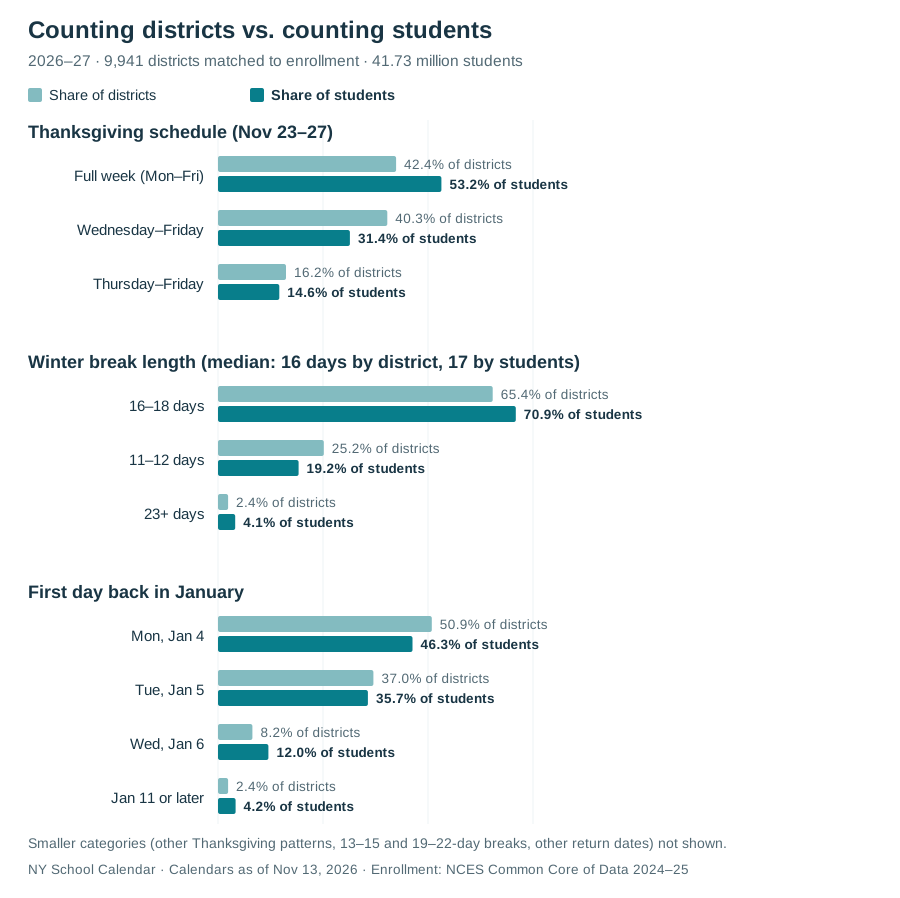
| Measure | Share of districts (9,941) | Share of students (41.73M) |
|---|---|---|
| Thanksgiving: full week off | 42.4% | 53.2% |
| Thanksgiving: Wednesday–Friday | 40.3% | 31.4% |
| Thanksgiving: Thursday–Friday | 16.2% | 14.6% |
| Winter break median | 16 days | 17 days |
| Winter break: 16–18 days | 65.4% | 70.9% |
| Winter break: 11–12 days | 25.2% | 19.2% |
| Back Monday, Jan 4 | 50.9% | 46.3% |
| Back Wednesday, Jan 6 | 8.2% | 12.0% |
| Back Jan 11 or later | 2.4% | 4.2% |
Counting students moves every measure toward longer breaks. The full Thanksgiving week goes from 42.4% of districts to 53.2% of students—22.2 million children. The median winter break rises from 16 to 17 days. On Monday, January 4, 49.1% of districts are still closed, but those districts enroll 53.7% of students, or 22.4 million.
Big Districts Move Their States
A single large district can change a state's result:
- Nevada: Clark County closes only Thanksgiving Thursday–Friday. That schedule covers 18.2% of Nevada districts but 92.7% of Nevada students.
- New York: New York City (837,777 students) also closes only Thursday–Friday. Statewide, that schedule covers 19.6% of districts but 56.9% of students.
- Illinois: Chicago closes all of Thanksgiving week. The full week covers 28.5% of Illinois districts but 51.6% of students.
- California: Los Angeles Unified runs a 23-day winter break through January 11. Breaks of 23 days or more cover 22.6% of California districts but 33.8% of students.
- Virginia: Fairfax County takes Wednesday–Friday, as do 94.8% of students on the Virginia side of the D.C. metro. The full Thanksgiving week covers 32.8% of Virginia districts but only 13.0% of students.
The 20 Largest School Systems
Only six of the 20 largest U.S. school systems match their state's combined holiday median: Orange, Palm Beach, Gwinnett, Hawaii, Dallas, and Philadelphia. The other 14 differ, in both directions.
| School system | Students | Thanksgiving | Winter break | Combined days vs. state median |
|---|---|---|---|---|
| 1. New York City (NY) | 837,777 | Thu–Fri | Dec 23 → Jan 4 (11 days) | 15 vs. 16 (−1) |
| 2. Los Angeles Unified (CA) | 408,026 | Full week | Dec 18 → Jan 11 (23 days) | 32 vs. 26 (+6) |
| 3. Miami-Dade (FL) | 333,233 | Full week | Dec 18 → Jan 4 (16 days) | 25 vs. 26 (−1) |
| 4. Chicago District 299 (IL) | 324,130 | Full week | Dec 18 → Jan 5 (17 days) | 26 vs. 22 (+4) |
| 5. Clark County (NV) | 301,697 | Thu–Fri | Dec 18 → Jan 5 (17 days) | 21 vs. 22 (−1) |
| 6. Broward (FL) | 243,553 | Full week | Dec 18 → Jan 4 (16 days) | 25 vs. 26 (−1) |
| 7. Hillsborough (FL) | 220,360 | Full week | Dec 18 → Jan 4 (16 days) | 25 vs. 26 (−1) |
| 8. Orange (FL) | 205,853 | Full week | Dec 18 → Jan 5 (17 days) | 26 vs. 26 (0) |
| 9. Palm Beach (FL) | 189,634 | Full week | Dec 18 → Jan 5 (17 days) | 26 vs. 26 (0) |
| 10. Gwinnett County (GA) | 182,518 | Full week | Dec 18 → Jan 5 (17 days) | 26 vs. 26 (0) |
| 11. Fairfax County (VA) | 179,323 | Wed–Fri | Dec 18 → Jan 4 (16 days) | 21 vs. 23 (−2) |
| 12. Houston ISD (TX) | 176,727 | Full week | Dec 18 → Jan 5 (17 days) | 26 vs. 27 (−1) |
| 13. Hawaii DOE (HI) | 167,071 | Thu–Fri | Dec 18 → Jan 5 (17 days) | 21 vs. 21 (0) |
| 14. Wake County (NC) | 163,325 | Wed–Fri | Dec 18 → Jan 4 (16 days) | 21 vs. 22 (−1) |
| 15. Montgomery County (MD) | 159,181 | Thu–Fri | Dec 23 → Jan 4 (11 days) | 15 vs. 17 (−2) |
| 16. Charlotte-Mecklenburg (NC) | 147,299 | Wed–Fri | Dec 18 → Jan 4 (16 days) | 21 vs. 22 (−1) |
| 17. Dallas ISD (TX) | 139,802 | Full week | Dec 18 → Jan 6 (18 days) | 27 vs. 27 (0) |
| 18. Prince George's County (MD) | 132,123 | Wed–Fri | Dec 18 → Jan 4 (16 days) | 21 vs. 17 (+4) |
| 19. Duval (FL) | 130,054 | Wed–Fri | Dec 18 → Jan 6 (18 days) | 23 vs. 26 (−3) |
| 20. Philadelphia (PA) | 120,057 | Wed–Fri | Dec 22 → Jan 4 (12 days) | 17 vs. 17 (0) |
Prince George's County's June 15 end date comes from its official 2026–27 calendar; seniors finish May 7. New York City's enrollment combines its 33 geographic districts.
Even within one state, the largest districts do not agree. Florida's six largest systems give 23, 25, or 26 days. Maryland's two largest, Montgomery and Prince George's, are six days apart. Los Angeles Unified gives six more days than the California median, and Chicago four more than the Illinois median.
City, Suburb, Town, and Rural Districts
Swipe sideways to read the full figure.
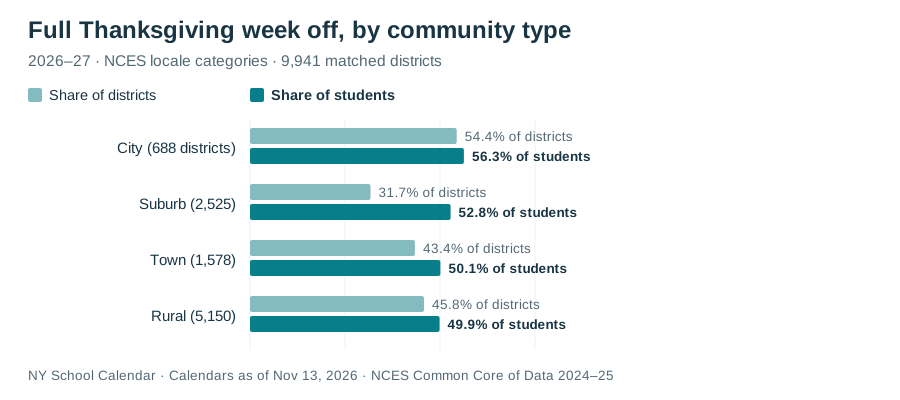
| Group | Districts | Students | Full Thanksgiving week (districts / students) | Combined median | Four-day-week districts |
|---|---|---|---|---|---|
| City | 688 | 13.32M | 54.4% / 56.3% | 25 days | 2 |
| Suburb | 2,525 | 17.62M | 31.7% / 52.8% | 21 days | 6 |
| Town | 1,578 | 4.26M | 43.4% / 50.1% | 22 days | 22 |
| Rural | 5,150 | 6.53M | 45.8% / 49.9% | 22 days | 165 |
| 50,000+ students | 78 | 8.99M | 62.8% / 58.9% | 26 days | 0 |
| 10,000–49,999 | 735 | 14.55M | 60.0% / 64.4% | 25 days | 3 |
| 2,500–9,999 | 2,550 | 12.07M | 42.0% / 43.1% | 22 days | 16 |
| Under 2,500 | 6,578 | 6.11M | 40.4% / 38.1% | 22 days | 176 |
Suburbs show the biggest gap between the two counts. Only 31.7% of suburban districts close all of Thanksgiving week, but 52.8% of suburban students get the full week, so the suburban districts that close all week are larger on average than those that hold class early in the week. By students, cities (56.3%), suburbs (52.8%), towns (50.1%), and rural areas (49.9%) end up close together.
District size shows a clearer pattern. Districts with 10,000 or more students close all of Thanksgiving week at 60.0%–62.8% and have combined medians of 25–26 days; districts under 10,000 close the full week at 40.4%–42.0% with a 22-day median. Four-day school weeks are almost entirely a small-district practice: 176 of the 195 districts with a documented four-day week enroll fewer than 2,500 students, and 165 are rural.
4. Why States Differ: Four Kinds of School-Year Rules
The 12-day gap does not mean students in long-break states get less school. It reflects when the school year starts and how states count instructional time. Among districts with a recorded start date, 0.0% of Texas districts and 0.3% of California districts open in September, compared with 99.7% in New York and 90.2% in New Jersey.
The data also shows that the gap comes from state rules rather than local trade-offs. Nationally, districts that close the full Thanksgiving week have a 17-day winter median and Thursday–Friday districts have 11, which could suggest districts trade November days for December days. Inside individual states, they do not. In 23 states with at least 10 districts in both the full-week and Wednesday–Friday groups, 16 show the same winter median in both groups. Illinois, Kansas, and Missouri post 17 days either way.
Minutes or Hours, August Start, May Finish (Texas, Colorado)
In 2015, Texas replaced its 180-day minimum with a 75,600-minute requirement under HB 2610, and Districts of Innovation can opt out of the fourth-Monday-in-August start rule under § 25.0811 (as El Paso ISD's plan describes). Of Texas districts with full-year dates, 98.7% finish in May, with a 27-day combined holiday median.
Colorado reaches the same 27-day median under C.R.S. § 22-32-109(1)(n), which sets a 160-day baseline and scheduled minimums of 1,080 hours for secondary and 990 for elementary students (state guidance lists lower actual-hour floors after allowed adjustments). Counting hours allows four-day weeks, used by 32 of 135 reviewed Colorado districts. The 32 four-day districts and the 103 five-day districts have the same 27-day median, and 93.6% of Colorado districts with full-year dates finish in May.
Fixed Start and End Dates (North Carolina, Minnesota)
Under N.C. Gen. Stat. § 115C-84.2, traditional North Carolina schools generally start no earlier than the Monday closest to August 26 (August 24 in 2026) and end no later than the Friday closest to June 11; waivers let 36 of 106 reviewed districts start earlier. Fitting 185 days or 1,025 hours and a 17-day winter break into that window leaves little room at Thanksgiving: only 8.5% of districts close all week, and 88.7% take Wednesday–Friday. Neighboring South Carolina (59.2%) and Georgia (98.3%) close the full week far more often.
Minn. Stat. § 120A.40 generally bars classes before Labor Day, so 62.5% of Minnesota districts open in September. With the shortest median school year of the six benchmark states (275 days from first to last day), only 4.7% close all of Thanksgiving week, the winter median is 12 days, and 90.7% return on January 4.
August Start, June Finish (California)
California requires 180 instructional days (175 for charter schools) plus grade-level minutes and leaves start dates to districts. Only 0.3% of California districts open in September, and 80.1% finish in June, giving the longest median school year of the six states at 296 days. That extra room supports a 26-day combined median and 177 winter breaks of three weeks or more.
September Start, 180 Days, Breaks Spread Across the Year (New York, New Jersey)
New York ties state aid to a 180-day minimum under Education Law § 3604 and requires 900 annual instructional hours for grades K–6 and 990 for grades 7–12. All 448 New York districts with full-year dates finish in June, with Regents exams in late June. Districts in this group spread their days off across the year. New York City's 2026–27 calendar (NYC calendar page) is one example: it holds class November 23–25 and December 21–23 and uses those days elsewhere, including a full-week February recess. District-by-district December dates for the state are in our New York winter break guide.
| State | Key rule | Median school year (finish month) | Combined holiday median |
|---|---|---|---|
| New York | 180 days + annual hours (§ 3604); June Regents exams | 295 days (100.0% June) | 16 days |
| Minnesota | No classes before Labor Day (§ 120A.40), with exceptions | 275 days (56.3% June / 43.8% May) | 17 days |
| North Carolina | Fixed late-August start and mid-June end (§ 115C-84.2), with exceptions | 284 days (60.4% May / 39.6% June) | 22 days |
| California | 180 days + minutes; local start dates | 296 days (80.1% June / 19.9% May) | 26 days |
| Colorado | 1,080 / 990 scheduled hours + 160-day baseline (§ 22-32-109) | 284 days (93.6% May / 6.4% June) | 27 days |
| Texas | 75,600 minutes (§ 25.081); August start exemptions | 283 days (98.7% May / 1.3% June) | 27 days |
Because these rules change only through legislation, the same states tend to hold class on the same split days from year to year.
Results for All 50 States
Each row counts every district once, using the full 10,095-calendar sample. "Full Thanksgiving week off" means no classes Monday–Friday, November 23–27. Winter break length counts consecutive days off, including weekends and non-student days. The return date column shows the most common first day back and its share. Select a state to see its district calendars.
Scroll within the table for all 50 states; on small screens, swipe sideways for every column.
| State | Districts analyzed | Full Thanksgiving week off | Median winter break | Most common return date |
|---|---|---|---|---|
| Alabama | 139 | 94.2% | 18 days | Jan 5 46.0% |
| Alaska | 37 | 10.8% | 17 days | Jan 4 32.4% |
| Arizona | 110 | 32.7% | 16 days | Jan 4 68.2% |
| Arkansas | 197 | 99.0% | 17 days | Jan 5 57.4% |
| California | 780 | 94.5% | 17 days | Jan 4 42.1% |
| Colorado | 135 | 81.5% | 18 days | Jan 5 62.2% |
| Connecticut | 160 | 0.0% | 11 days | Jan 4 97.5% |
| Delaware | 19 | 52.6% | 13 days | Jan 4 78.9% |
| Florida | 67 | 98.5% | 17 days | Jan 5 46.3% |
| Georgia | 177 | 98.3% | 17 days | Jan 5 49.7% |
| Hawaii | 1 | 0.0% | 17 days | Jan 5 100.0% |
| Idaho | 93 | 65.6% | 17 days | Jan 4 74.2% |
| Illinois | 720 | 28.5% | 17 days | Jan 5 68.1% |
| Indiana | 217 | 6.5% | 16 days | Jan 4 47.0% |
| Iowa | 245 | 2.0% | 13 days | Jan 5 53.9% |
| Kansas | 215 | 54.4% | 17 days | Jan 5 74.4% |
| Kentucky | 166 | 23.5% | 17 days | Jan 5 53.6% |
| Louisiana | 64 | 100.0% | 17 days | Jan 5 57.8% |
| Maine | 49 | 12.2% | 12 days | Jan 4 100.0% |
| Maryland | 18 | 5.6% | 12 days | Jan 4 94.4% |
| Massachusetts | 274 | 1.5% | 11 days | Jan 4 96.0% |
| Michigan | 304 | 5.6% | 16 days | Jan 4 94.1% |
| Minnesota | 107 | 4.7% | 12 days | Jan 4 90.7% |
| Mississippi | 131 | 99.2% | 17 days | Jan 5 70.2% |
| Missouri | 465 | 35.3% | 17 days | Jan 5 82.6% |
| Montana | 48 | 2.1% | 16 days | Jan 4 93.8% |
| Nebraska | 196 | 1.0% | 17 days | Jan 5 79.6% |
| Nevada | 11 | 36.4% | 17 days | Jan 4 63.6% |
| New Hampshire | 50 | 0.0% | 11 days | Jan 4 100.0% |
| New Jersey | 504 | 0.0% | 11 days | Jan 4 99.0% |
| New Mexico | 50 | 62.0% | 17 days | Jan 5 48.0% |
| New York | 634 | 2.5% | 11 days | Jan 4 99.4% |
| North Carolina | 106 | 8.5% | 17 days | Jan 5 44.3% |
| North Dakota | 49 | 0.0% | 13 days | Jan 4 73.5% |
| Ohio | 585 | 22.2% | 16 days | Jan 4 66.5% |
| Oklahoma | 437 | 97.5% | 17 days | Jan 5 63.2% |
| Oregon | 103 | 49.5% | 17 days | Jan 4 64.1% |
| Pennsylvania | 477 | 11.9% | 11 days | Jan 4 96.6% |
| Rhode Island | 34 | 0.0% | 12 days | Jan 4 100.0% |
| South Carolina | 71 | 59.2% | 17 days | Jan 5 77.5% |
| South Dakota | 48 | 2.1% | 13 days | Jan 4 / Jan 5 47.9% each |
| Tennessee | 104 | 60.6% | 17 days | Jan 5 65.4% |
| Texas | 990 | 98.5% | 18 days | Jan 5 53.7% |
| Utah | 34 | 0.0% | 16 days | Jan 4 50.0% |
| Vermont | 49 | 51.0% | 11 days | Jan 4 89.8% |
| Virginia | 120 | 32.5% | 17 days | Jan 4 41.7% |
| Washington | 268 | 11.9% | 16 days | Jan 4 94.0% |
| West Virginia | 44 | 93.2% | 16 days | Jan 4 59.1% |
| Wisconsin | 153 | 16.3% | 12 days | Jan 4 96.1% |
| Wyoming | 40 | 7.5% | 17 days | Jan 4 57.5% |
Hawaii runs a single statewide school system, so its row reflects the statewide calendar. In states with few reviewed districts, such as Nevada (11), percentages describe those districts; see Section 3 for how large districts like Clark County change the picture by students.
Frequently Asked Questions
How long is winter break for most U.S. school districts in 2026–27?
Most districts fall into one of two sizes: 65.6% take 16–18 consecutive days off and 25.0% take 11–12 days. The median is 16 days by district count and 17 days when weighted by enrollment. The most common window has classes ending Friday, December 18, and students returning Tuesday, January 5, used by 2,892 districts (28.6%).
Which Thanksgiving break schedule is most common?
Across all 10,095 districts, closing all five weekdays of November 23–27 (42.3%) narrowly leads closing Wednesday through Friday (40.5%), with Thursday–Friday only at 16.2%. Among the 9,941 districts matched to enrollment, the full week covers 42.4% of districts but 53.2% of students, making it the majority schedule for students.
Which days cause the most scheduling conflicts between school districts?
Eight weekdays: Monday–Wednesday, November 23–25; Monday–Wednesday, December 21–23; and Monday–Tuesday, January 4–5. Every district in the study is closed November 26–27 and December 24–January 1. On the eight split days, the share of districts closed ranges from 12.1% (January 5) to 83.7% (November 25).
Why do some states get 27 days of Thanksgiving and winter break and others only 15?
State school-year rules. Texas counts instruction in minutes and Colorado in hours, and nearly all of their districts start in August and finish in May; both states post a 27-day combined median. New York, New Jersey, and Minnesota rely on September starts, 180-day minimums, or Labor Day rules and hold the two breaks to 15–17 days.
Do the largest school districts follow their state's holiday schedule?
Most do not. Among the 20 largest U.S. school systems, 14 differ from their state's combined holiday median. Los Angeles Unified gives 32 days, six more than the California median, and Chicago gives 26, four above Illinois. Duval County gives three days fewer than the Florida median.
Do school breaks line up in metro areas that cross state lines?
It depends on the metro. In the Washington, D.C. suburbs, schools in Maryland, Virginia, and West Virginia disagree on seven weekdays between November 16 and January 15, and Cincinnati-area schools disagree on three. In the New York–Newark–Jersey City area, with 492 districts and 2.3 million students, New York and New Jersey schools disagree on none.
Methodology and Sources
The study covers 10,095 official 2026–27 calendars from public school districts, charter networks, and Hawaii's statewide system in all 50 states, collected through November 13, 2026. Of 10,740 records reviewed, 645 were excluded as drafts, incomplete holiday windows, or conflicting campus schedules. For student counts, community types, district sizes, the largest-district comparison, and metro areas, we matched calendars to 2024–25 NCES Common Core of Data enrollment and July 2023 Census metro area definitions. The 9,941 matched districts (98.5%) enroll 41,730,988 students, 84.7% of the 49,260,525 public school students in the 50 states and D.C.
Detailed definitions and study rules
- One calendar per district: Each district, charter network, or statewide system counts once, using its primary K–12 or grade-band calendar. New York City's 33 geographic districts share one calendar and are combined into one system of 837,777 students (District 75 students are counted in their home districts).
- Required holiday windows: Every included calendar shows student closures on November 26–27 and continuously from December 24 through January 1. Incomplete records are excluded, not filled in from neighbors.
- Enrollment matching: 154 of 10,095 calendars (1.5%) are left out of student-weighted results: 149 could not be matched to federal records, 4 had suppressed enrollment, and 1 reported zero students. Comparisons between districts and students use the 9,941 matched districts, so district shares there can differ by a tenth of a point from full-sample figures (for example, 42.4% vs. 42.3% for the full Thanksgiving week).
- Breaks and return dates: Date ranges are inclusive. Teacher-only workdays and documented four-day-week days off extend a break when students are home; early dismissals and remote-learning days count as school days. The first scheduled class day sets the return date.
- Subsamples and metro areas: Opening-month figures use 9,393 districts with a recorded start date; school-year length and May-vs.-June finishes use 8,635 districts with both start and end dates; within-state comparisons require at least 10 districts in each group. A metro "split day" is a weekday from November 16 to January 15 when more than half of one state side (by districts or by students) is closed and more than half of another is open. Washington, D.C. had no calendar in the sample, so its metro comparison covers Maryland, Virginia, and West Virginia suburbs.
- Sources: District websites and official 2026–27 calendars collected through November 13, 2026; the state laws and guidance linked above; NCES Common Core of Data 2024–25; and Census metro area delineation files (July 2023).